Weibull
A useful general distribution for describing failure time data is the Weibull distribution named after the Swedish professor Waloddi Weibull (1887-1979), who demonstrated the appropriateness of this distribution for modeling a wide variety of different data sets.It is often meaningful to consider the function that describes the probability of failure during a very small time increment (assuming that no failures have occurred prior to that time). This function is called the hazard function (or, sometimes, also the conditional failure, intensity, or force of mortality function), and is generally defined as:
h(t) = f(t)/(1-F(t))
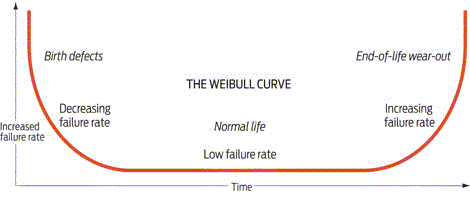
where h(t) stands for the hazard function (of time t), and f(t) and F(t) are the probability density and cumulative distribution functions, respectively. The hazard (conditional failure) function for most components or devices can best be described in terms of the “bathtub” curve: Very early during the life of a device, the rate of failure is relatively high (so-called Infant Mortality Failures); after all components settle, and the electronic parts are burned in, the failure rate is relatively constant and low. Then, after some time of operation, the failure rate again begins to increase (Wear-out Failures), until all components or devices will have failed.

The Weibull distribution is flexible enough for modeling the key stages of this typical bathtub-shaped hazard function.Weibull distribution is very useful in reliability because of its ability in modelling increasing and decreasing failure rate functions.ALD solution fully supports Weibull analysis as part of its approach to failure analysis, understanding and prevention.By utilizing Weibull distribution ALD team can understand the reasons for failure causes and establish a lasting preventive action.
RAM Commander Weibull Module
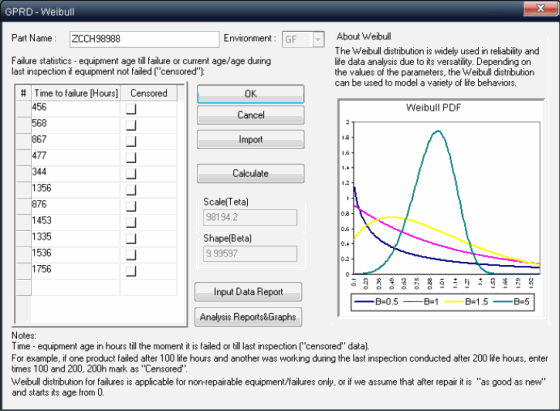
RAM Commander reliability software provides Weibull module allowing input/import of failure statistics (time to failure) and calculation of Weibull distribution parameters (Shape and Scale):
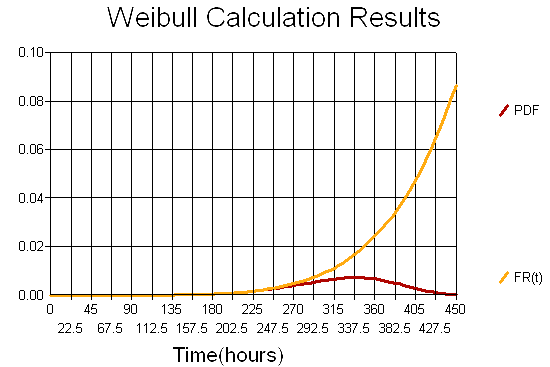
Weibull parameters calculation algorithm takes into consideration “censored” data too, e.g. not only failures but also times at which equipment was tested and appeared to be operational.After the calulation user may generate Weibull reports and graphs like PDF (Probability Density Function), CDF (Cumulative Distribution Function), FR(t), number of failures till time t etc. to predict failures, plan warranty times etc.:
Distribution parameters can be used in system reliability analysis using Reliability Block Diagrams module of RAM Commander.


